What ?!!!.
I remember reading complains in the past that there are no download counts on F-Droid and that it’s easy to miss some great FOSS apps. So I came up with a solution: put all the apps in a table and include various details including GitHub/GitLab stars. Sort the table by the latest additions, updates, stars, filter by category, description or just anything…
Check it out at GitHub - moneytoo/awesome-fdroid: 📊 A table to sort, filter and discover popular F-Droid apps
1 Like
(っ◔◡◔)っ ![]() FRESH STATS
FRESH STATS ![]() F-Droid Stats - Divested Computing
F-Droid Stats - Divested Computing
@thore here is a script to make part of it multithreaded, it could further be made faster by adjusting plot_data to take the same txt file as parse_data
split -n32 --additional-suffix=.txt all_apps.txt all_apps-split-

for f in all_apps-split-*.txt
do
	python parse_data.py $f &
done

wait

rm -fv all_apps-split-*.txt

python plot_data.py --name-avg

find "graphs/" -type f -name "*.png" -print0 | xargs -0 -n1 -P 32 optipng -strip all;
2 Likes
@anon84241408 Thanks for pointing me here and to the metrics, I wasn’t aware of them. I also included these already in my table but took a different approach.
Weekly average might be skewed by the number of app updates and swarns of users updating previous installations. So my take is to get to the average downloads per app version. I’m hoping this would tell about app user base and popularity. (To get proper numbers I also have to convert versionCode to versionName because of the per arch release apks.)
Anyway, I also tried getting download counts from Google Play. Maybe around 20% of apps is there under matching package id. That’s not much but also it’s not nothing.
3 Likes
I was just playing around with F-Droid metrics data to find some useful things to derive. One thing that seems relatively reliable to derive is number of app downloads. Apps are files that end with .apk:
import requests
hits = {'http02': 0, 'http03': 0}
for host in ('http02', 'http03'):
    r = requests.get(f'https://fdroid.gitlab.io/metrics/{host}.fdroid.net/2025-05-26.json')
    data = r.json()
    for path in data['paths']:
        if path.endswith('.apk'):
            hits[host] += data['paths'][path]['hits']
    print(host, '.apk hits:', hits[host])
print('average:', (hits['http02'] + hits['http03']) // 2)
That gives an average of 2,140,956 hits for each of the two “fronter” servers for f-droid.org. The official client downloads APKs from a random mirror each time. And the f-droid.org set up means clients randomly choose between the two active fronters. How many official mirrors are active?
import requests
import yaml
r = requests.get('https://gitlab.com/fdroid/fdroiddata/-/raw/master/config/mirrors.yml')
data = yaml.safe_load(r.text)

onion = 0
https = 0
for d in data:
    url = d['url']
    if '.onion/' in url:
        onion += 1
    else:
        https += 1
print('URLs:', https, onion)
So if we guess that each https:// mirror serves about the same amount of APKs as each f-droid.org fronter, then there are 16 official mirrors and 2 fronters making a total of 18. So 18 times 2,140,956 gives roughly 38,537,208 APK downloads per week. But that is not the whole story. That leaves out the official Onion Service fdroidorg6cooksyluodepej4erfctzk7rrjpjbbr6wx24jh3lqyfwyd.onion as well as the .onion mirrors. Using the same script at the top gives us 257 APK downloads. Not many, but that seems inline with the 188 downloads of index-v2.json. Then multiple 6 times 257 to get 1542.
Another thing to consider is that the fdroid-metrics script ./compile-logs-into-hits.py only includes a path if it has at least 100 hits. So the long tail of apps will not be included in this metric. So this number of about 38,500,000 app downloads could be an undercount. But then also, non-official client apps do not always download from the mirrors, so the mirrors might actually see quite a bit less traffic. That means 38,500,000 would be a an over-estimate.
Some mirrors do publish some metrics. That could be used to compare to the fdroid-metrics data to make a better estimate of how many downloads the mirrors are getting.
2 Likes
can you redo the numbers without Termux pls?
You can look at the raw numbers for Termux in the JSON files, e.g.
https://fdroid.gitlab.io/metrics/http03.fdroid.net/2025-05-26.json, they don’t
seem so high. If you want to play with this data, it should be easy to do in
the scripting language of your choice. Need an example?
Licaon_Kter via F-Droid Forum:
a bash example to extract numbers per appid would be nice
eg. I counted ~310k for /repo/com.termux_*.apk on 02 and 03 fronters
This will print out the hits for each APK:
#!/bin/sh

cd /tmp/
wget -c https://fdroid.gitlab.io/metrics/http03.fdroid.net/2025-05-26.json

for path in $(grep -Eo '/repo/[^"/]+\.apk' 2025-05-26.json); do
    printf "%s\t${path}\n" $(jq '.paths."'$path'"["hits"]' 2025-05-26.json 2> /dev/null)
done
1 Like
(っ◔◡◔)っ ![]() FRESH STATS
FRESH STATS ![]() F-Droid Stats - Divested Computing
F-Droid Stats - Divested Computing
minor fix to my script in the last post: split -n32 needs to be split -n l/32 to prevent splitting mid line
also the graph is now so wide that you have to zoom in to read them since it has ~17 months of numbers, might have to trim them down in future
also for fun abnormalities: Arity had nearly 1 million downloads? https://divested.dev/images/fdroidstats/27660-org.woheller69.arity.png
1 Like
I wanted a quick metric on how important translations are. The locale each device is using is not gathered. So I put together a quick rule of thumb to see if it gave some useful numbers. I split the hitsPerCountry data by English-speaking countries, countries where English is widespread, and everything else. I got:
| english | some | not |
|---|---|---|
| 0.31% | 0.33% | 0.36% |
Here’s the script:
#!/usr/bin/python3

import json
import os
import pycountry
import requests
import requests_cache

session = requests_cache.CachedSession(os.path.basename(__file__) + '_cache_')

english_countries = ('AU', 'CA', 'GB', 'IE', 'US')
some_english_countries = ('AT', 'BE', 'CH', 'DE', 'DK', 'FI', 'HK', 'IN', 'NL', 'NO', 'PH', 'SE', 'SG')

hits = 0
english = 0
some_english = 0
non_english = 0

for host in ('http02', 'http03'):
    i = requests.get(f'https://fdroid.gitlab.io/metrics/{host}.fdroid.net/index.json')
    for datafile in i.json():
        r = requests.get(f'https://fdroid.gitlab.io/metrics/{host}.fdroid.net/{datafile}')
        data = r.json()
        hits += data['hits']
        hitsPerCountry = data['hitsPerCountry']
        for country in hitsPerCountry:
            if country in english_countries:
                english += hitsPerCountry[country]
            elif country in some_english_countries:
                some_english += hitsPerCountry[country]
            else:
                non_english += hitsPerCountry[country]

print('english', 'some', 'not', sep='\t')
print(
    '%0.02f%%' % (english / hits),
    '%0.02f%%' % (some_english / hits),
    '%0.02f%%' % (non_english / hits),
    sep='\t',
)
1 Like
Seems other countries % is high, also given the list is bigger compared to the native ones.
that amounts to 1%
what about the rest 99%? ![]()
1 Like
I’m not sure I understand what you mean. You think 36% is too high for the
non-English speaking countries? Without other sources of data, there are too
many other variables involved, so this datapoint won’t ever translate well to
other metrics, like how many users are using a non-en locale.
I only meant from this data pov that you shared. From that view “some” english speaking countries % showed more. Agreed, many other variables are necessary for correct results.
The key missing data points would be what percentage of people in the “some”
countries are using their phone in an en locale. Then of those that are not,
how many are OK with seeing English mixed in? I know must German-speaking
developers are totally fine with mixing in English, while my German-speaking
family would be pissed.
1 Like
Very true. It really irritates many people here, especially in my city.
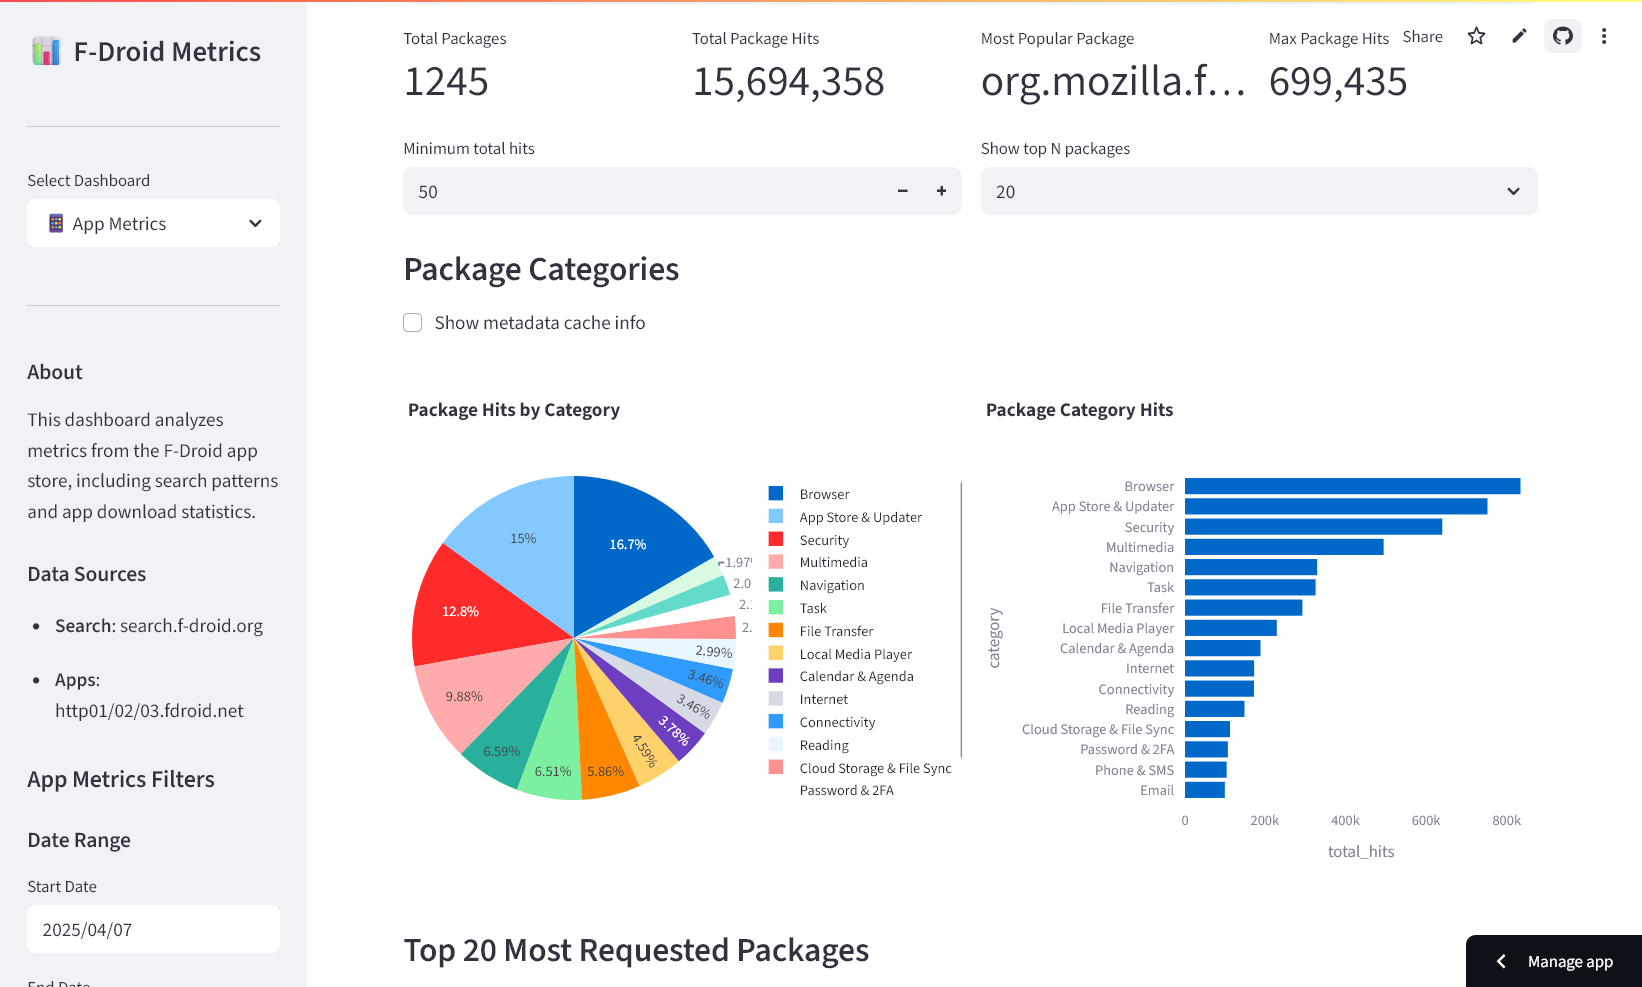
A dashboard with the published data.
https://fdroid-metrics.streamlit.app/
You can also run it locally. GitHub - kitswas/fdroid-metrics
The calculations are a bit iffy. (My calculations always are ![]() )
)
The data fetcher needs a bit of work too on the user-friendliness side.
And I am unsure whether the data labels mean what I think they mean. (Is hit == download ?)
Enjoy it while it works! I probably won’t maintain it long-term.
6 Likes
can you disable googletagsmanager and segment.com trackers?